
Field Note 16 / Derivatives and Trading Claims
Crypto Liquidation Data: Where Is the Trading Edge?
A liquidation cluster can be real. The profitable trade inferred from it still needs evidence.
I keep seeing claims from private trading groups charging around $200 for access. The language sounds informed: short liquidations, open interest, funding, gamma concentrations. The charts look like something a retail trader could never reconstruct alone. Then comes the leap: this is where price will go, and this is how you will profit.
That leap is the part I wanted to test.
This is a personal observation about offers I encounter, not a survey of subscription prices or an audit of a named provider. A paid service may offer useful education, data or execution support. But its fee does not establish that its market interpretation predicts a tradeable move.
We collected BTC derivatives data and tested specific ways of using it. The preliminary answer is uncomfortable but useful: we can observe positioning changes and market stress without establishing a reliable forecast of what happens next. If there is alpha in these feeds, our tests have not established it in the forms we examined.
What this research establishes
- Liquidation events, estimated liquidation zones and option-gamma concentrations are different objects. A concentration alone does not determine the next price move.
- Across 24 primary comparisons, our fixed derivatives features did not significantly improve next-four-hour forecasts beyond price and volatility.
- There are interesting observations and weak leads. Neither a positive correlation nor a small improvement in forecast error is evidence of trading profit.
- Research on order flow and dealer hedging finds real mechanisms. Those findings do not validate an arbitrary signal sold in a chat group.
A liquidation map is not a record of tomorrow's orders
Start by asking what the picture actually measures.
A feed of executed liquidations records forced closures that have already occurred. A heatmap of potential liquidation levels estimates where future forced closures might occur under its modelling assumptions. Option gamma measures a different form of sensitivity altogether. Combining them under the word “liquidity” does not make them interchangeable.
For example, CoinGlass's liquidation-heatmap API documentation describes its levels as calculated from market data and leverage levels. That is a model-based product, not direct disclosure of every account's future forced orders. Our study used recorded liquidation events; it did not backtest CoinGlass heatmaps or any private group's calls.
Even if a cluster is estimated well, several questions remain: will price reach it, when, what happens before it gets there, and what follows if forced orders begin? Showing where stress may concentrate does not answer all four.
The same care applies to a chart of unsigned gamma. It can show a concentration of option sensitivity near certain strikes. Without the sign of the relevant holders' positions and an adequate hedging model, it cannot tell us whether subsequent hedge adjustments will amplify or dampen a move. Our earlier gamma field note explains that specific limitation. This article asks the broader question: how much evidence is needed before turning derivatives context into a paid trading claim?
What the data can tell us
Open interest is the number of outstanding contracts. Each contract has a long and a short side. A rise in OI alone does not identify which side initiated the trade or reveal a collective directional intention. Binance Academy's explanation of open interest distinguishes the creation and closure of contracts from trading volume.
Price, changes in OI and the side of observed liquidations together provide a more informative description:
| Observation | Supported interpretation | Additional claim requiring a test |
|---|---|---|
| Price falls, OI falls, long liquidations dominate | Contracts are shrinking while forced long closures occur | Sellers are exhausted; buy the rebound |
| Price falls while OI rises | Contract counts grow during the decline | New shorts will force price lower |
| Price rises while OI falls | Price rises as contracts shrink; short liquidations may add context | The whole move is a squeeze that will now reverse |
| Price rises while OI rises | Price and contract counts rise together | The trend will continue |
Funding adds information about holding conditions for perpetuals. Option tape adds activity and taker-side trade information. Neither automatically completes the missing forecast.
As discussed in our volatility-versus-direction article, those are different forecasting tasks. This is not a claim that market data contain no directional information. It is a distinction between a measured variable, an interpretation of that variable and an outcome demonstrated on data available at the time of a decision.
We tested the feeds, separately from BOS
The latest collector study in our public BOS research archive examines five feeds: OI, funding/mark price, liquidations, unsigned gamma and the Deribit option tape. BOS (break of structure) was not used as a feature, filter or event clock. This separates the question about derivatives data from the question about the structural scanner.
The mark-price archive spans 29 August to 14 October 2026, approximately 45.5 days. After quality filters, feature availability and chronological training, the forecasting comparisons contain only 51 to 119 four-hour test windows, across 14 to 25 distinct days, depending on the feature set and outcome. A long list of raw messages is not a long list of independent market regimes.
The gamma features were unsigned asymmetry and total exposure within ±5% of spot. Tape features measured four-hour notional activity and the difference between signed call and put notional, normalised by total notional. These are specific observables, not a test of every interpretation of options positioning.
The design was deliberately bounded:
- Twelve predefined feature sets, each tested against next-four-hour returns and realised volatility: 24 primary comparisons.
- A fixed Ridge regression model, which shrinks fitted coefficients to limit overfitting, with no parameter search, initially trained on 14 calendar days and then tested in subsequent weekly blocks with expanding training.
- A baseline using past returns and volatility. Each augmented model and its baseline use the same available rows and dates.
- Availability checks using exchange and receive times for option trades, completed gamma snapshots and outage masks. Backfilled data are not treated as known earlier.
- Daily block-based uncertainty estimates and correction across the 24 primary comparisons.
The primary future windows do not overlap. Nevertheless, this is not untouched out-of-sample research: the historical period had been examined in other laboratories. These are chronological diagnostic tests, not a live trading strategy, and they do not cover every possible nonlinear feature or trading rule.
Strong descriptions, unestablished forecasts
Mean squared error (MSE) is the average squared difference between a forecast and its realised outcome. Lower MSE means a more accurate forecast against the matched baseline. Realised volatility measures the size of price fluctuations, rather than their direction. This is why a volatility forecast cannot simply be relabelled a long or short signal.
The clearest relationships were with movement happening in the same window. On non-overlapping four-hour observations, liquidation activity had a Spearman correlation of 0.82 with contemporaneous realised volatility. Option-tape activity had a correlation of 0.76 with that volatility. These are rank associations, not forecast accuracy or win rates. The definitions and results are in the collector report.
Large liquidation activity during a violent move is meaningful. It tells us something about the process unfolding. But much of that stress is also visible in price. The relevant forecasting question is whether the additional feed tells us more about the next window than past price and volatility already do.
None of the 24 primary comparisons showed statistically significant improvement, even before the multiple-testing correction under the chosen daily sign-flip test. After Holm correction, all p-values were 1. That does not mean there is a 100% probability of no effect. It means these tests did not establish the improvement being sought.
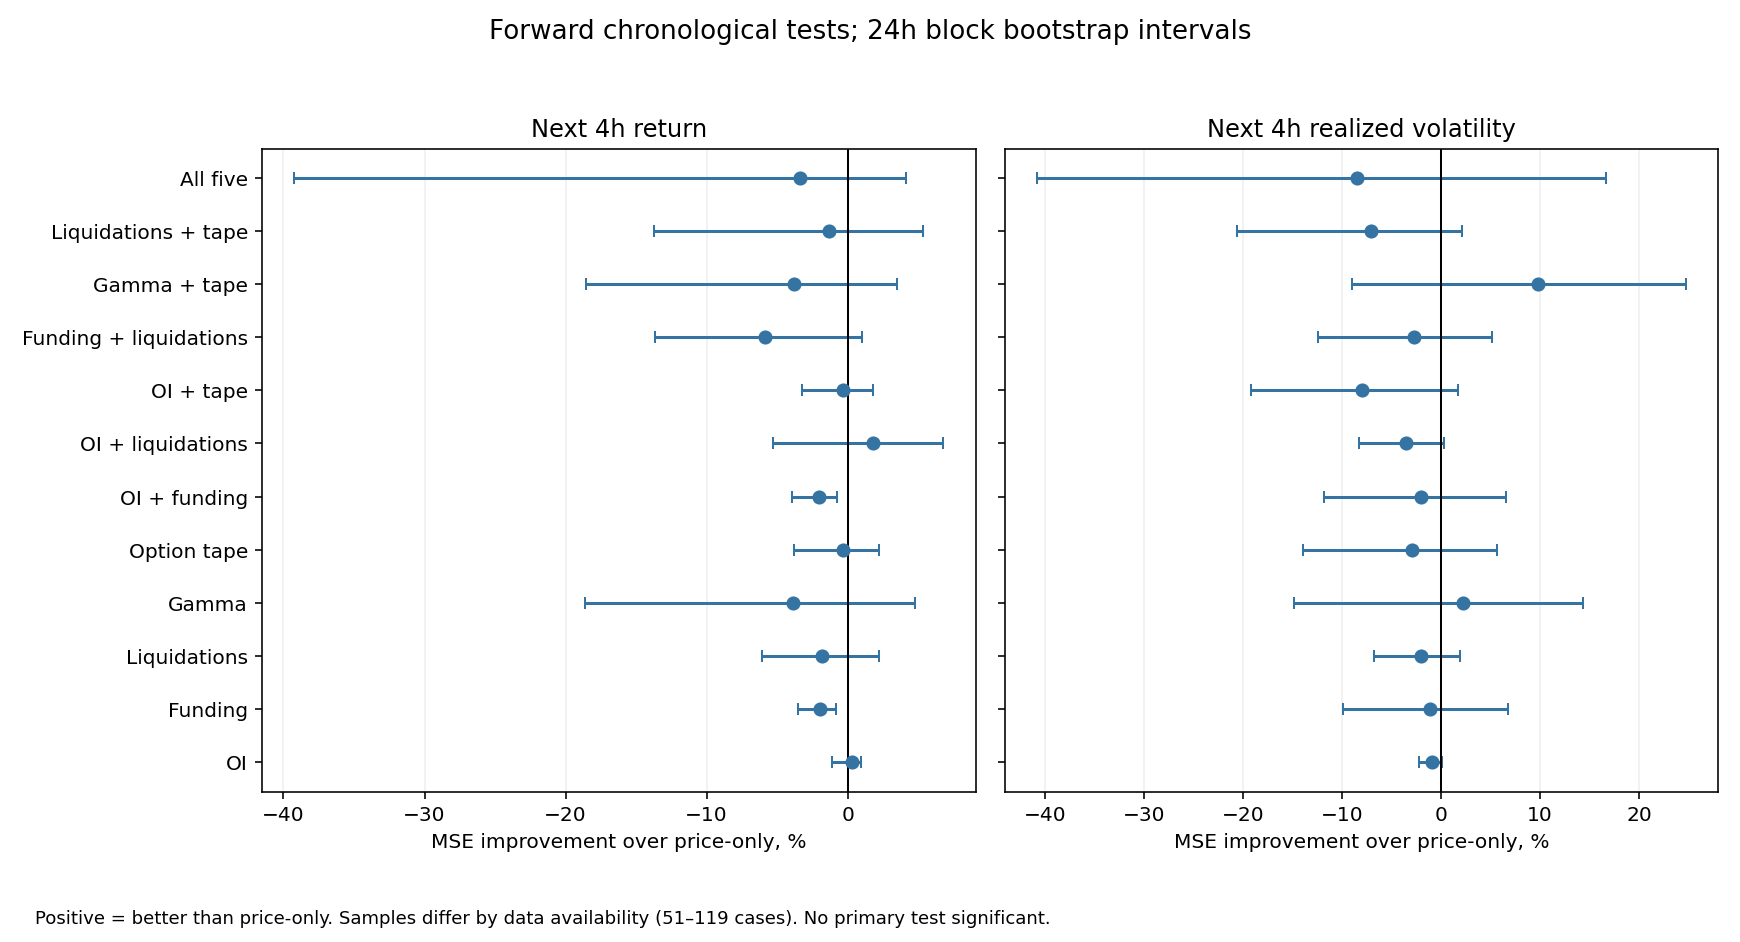
Karaptic collector laboratory, 14 October 2026. Positive values mean lower mean squared forecast error than the price/volatility baseline; they are not investment returns. Each comparison uses matched rows, but sample availability differs between feature sets. The intervals are approximate 95% daily block-bootstrap diagnostics, using the 2.5th and 97.5th percentiles. The chart abbreviates the past-price/volatility baseline as “price-only”.
The most interesting positive estimates were these:
| Feature combination | Outcome | Estimated MSE improvement | Approximate 95% interval | Main weakness |
|---|---|---|---|---|
| OI + liquidations | Next-four-hour return | +1.8% | −5.3% to +6.8% | Better than baseline in only 2 of 5 weekly blocks |
| Gamma + option tape | Next-four-hour volatility | +9.8% | −9.0% to +24.7% | Only 53 observations across 14 days and 3 weekly blocks; sensitive to trade composition |
For gamma + tape, excluding block/combo/RFQ trades changed the estimated improvement to −1.2%. A result that depends on how complex option trades are included cannot be presented as a robust “smart money predicts risk” rule. Both leads deserve specific new-data questions, rather than a profit claim. Results and sensitivity checks.
One useful observation, without pretending it is a rule
On 8 October at 16:00 UTC, BTC mark price had fallen about 1.77% over the preceding four hours. OI had fallen about 2.38%. Our liquidation feed recorded roughly $51.4 million over that window, with about 95% of the recorded notional on the long-liquidation side.
That combination describes a decline accompanied by shrinking contract counts and observed forced long closures. It is more specific than “the chart is red”.
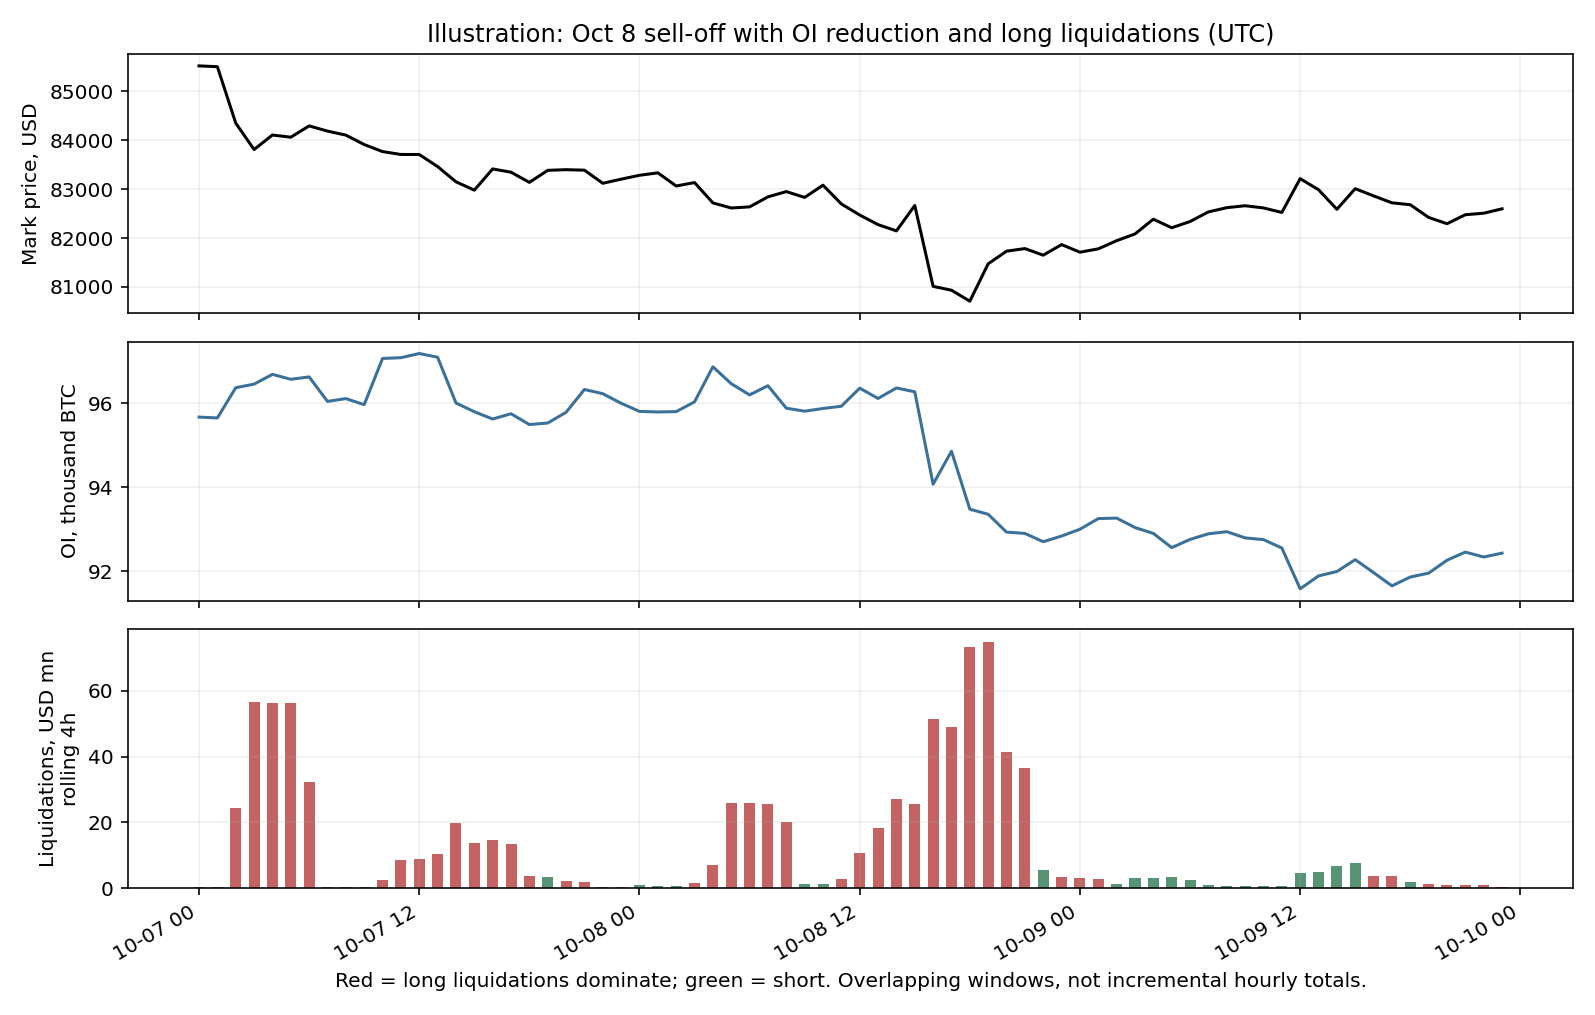
An illustration selected after inspecting the data, not an independent confirmation. Liquidation bars use rolling four-hour windows and must not be summed as hourly totals. The feed is a Binance sample, not a complete market-wide record.
Price rose about 0.89% in the following four hours. That is an outcome we know afterwards. It does not establish that buying this configuration is profitable. Other comparable episodes, a frozen entry rule, adverse movement, execution costs and genuinely new observations would all matter. The report's event analysis preserves that distinction.
The useful question is narrower: after comparable declines, do falling OI and observed long liquidations help distinguish recovery from continuation beyond what price already tells us?
What other research actually finds
We are not alone in needing a more precise definition than “there is a cluster”. But the literature is not a collection of studies proving that all these data are useless. Several sources find real market mechanisms, under specific conditions.
Osler: clustered stops can propagate a move. Carol Osler's Stop-Loss Orders and Price Cascades in Currency Markets, issued as a New York Fed staff report in 2002 and published in 2005, finds evidence that documented currency stop-loss clusters contribute to rapid, self-reinforcing moves. The effects are stronger for stop-loss than take-profit orders and persist over hours rather than days. This supports a mechanism involving actual order placement. It does not show that a retail BTC heatmap can predict which cluster price will visit first.
Cont, Kukanov and Stoikov: the relevant imbalance matters. Their The Price Impact of Order Book Events, published in 2014, studies 50 US stocks. At short intervals, changes in best-bid/ask supply and demand explain price changes more robustly than trading volume alone, with market depth affecting impact. This is evidence about a specifically defined order-book variable. Our aggregate liquidation totals and option notional are not that variable, and explaining price impact is not automatically a cost-adjusted retail strategy.
Amaya and coauthors: dealer positions, not option volume alone. In the January 2025 working paper 0DTE Index Options and Market Volatility: How Large is Their Impact?, Diego Amaya, Pedro A. Garcia-Ares, Neil D. Pearson and Aurelio Vasquez use proprietary trade data to estimate aggregate option-market-maker positions and gamma. They study volatility effects and distinguish positive from negative dealer gamma. This is a different informational basis from our unsigned BTC gamma snapshots, in a different market. It supports investigating hedging mechanisms; it does not validate our feature or a BTC direction call.
Amberdata: even signed option flow requires assumptions. Decoding Option Flows: Q2, 2023, published on Deribit Insights, describes heuristics for trade-direction estimation and separates screen trades from single- and multi-leg blocks. Its dealer-gamma model explicitly assumes roles for takers, makers and hedgers and acknowledges missing activity across venues. This is an industry methodology report, not a peer-reviewed validation of our scanner. It explains why adding call notional and subtracting put notional does not directly reveal dealer hedging.
The common lesson is a demand for specificity: which position, order, side, timestamp, market and outcome are being measured? Those sources do not establish that future direction is unknowable. They do show why “I have derivatives data” is a much weaker claim than “I have demonstrated a profitable signal”.
What a paid signal would need to demonstrate
A subscription can pay for research, convenience or teaching. Profitability is a separate proposition. If a group sells that proposition, I would look for a complete timestamped record of calls, including losses and revisions; rules that were knowable before the outcome; a simple baseline; and results after fees, funding, slippage and the subscriber's actual entry delay.
As our backtesting win-rate analysis illustrates, an impressive headline statistic still needs a valid definition. A successful screenshot cannot show the missing denominator. A short-liquidation story written after a rally cannot establish an entry before the rally. And an unspecified horizon lets a prediction remain “right eventually” while the position fails in the meantime.
This matters more when a narrative becomes a leveraged futures position. The CFTC's customer advisory on virtual-currency trading explains that leverage amplifies losses and can force additional margin or position closure. The danger is not simply losing the subscription fee. Confidence borrowed from an unverified signal can put the trading deposit at risk.
Our small study cannot determine whether a particular group is honest or profitable. It can identify the evidence that our own data do not yet provide. A service deserves scrutiny when certainty about profit arrives before that evidence.
Where the next useful question begins
The preliminary conclusion is not that alpha cannot exist in derivatives data. It is that we have not established it in the specific forecasts and definitions tested here. A different observable, horizon or model would need its own protocol and evidence, not retrospective credit for a move that already happened.
There is still valuable work to do: compare recovery and continuation after matched price declines; separate ordinary option activity from structured trades; preserve receive-time availability; and test frozen definitions on new events. Our public BOS archive contains the reports, scripts and derived tables. Some external raw sources are not included, so this is an inspectable research package rather than a promise of one-command reproduction.
For now, the honest product is a map of observations and a small set of questions. Turning that map into a promise of profit is the step that still needs proof.
About the author: Oleg Arefev is the independent researcher behind Karaptic, which publishes its crypto-market experiments and negative or inconclusive results.