
Field Note 14 / BTC Derivatives
BTC Gamma: Gas, Brake, or an Unconfirmed Hypothesis?
We tested whether BTC derivatives data could explain what happens after a break of structure. Gamma did not become a reliable accelerator or brake. One relationship with adverse movement over the next 24 hours remains worth testing on fresh data.
In September, we described the market archive we had started collecting: open interest, funding, liquidations, option gamma and the Deribit trade tape. The next question was whether those layers add useful information once the price structure is already known.
The first exploratory analysis is now complete. Its status is insufficient for confirmation. That leaves a narrower, more useful question: what did the data actually let us test, and which ideas are still only ideas?
What we know so far
- We have not established whether our gamma measures amplify or dampen BTC price moves.
- Gamma asymmetry was associated with deeper adverse moves across 36 structural transitions, but the result was selected after examining many tests.
- Concentration around a strike has not been validated as a price magnet, barrier or breakout accelerator.
Why “gas or brake” needs a sign we do not have
Gamma describes how an option’s delta changes as the underlying price moves. The proposed market mechanism involves the people holding those options and how they hedge. A large concentration of gamma around a strike does not, by itself, identify which way their hedging will push the market.
Our archive contains unsigned gamma exposure. It describes the size and location of exposure in the option chain, without establishing the sign of dealers’ positions. We cannot translate its bars directly into “dealers will buy a rally” or “dealers will sell a rally.”
That missing step is substantive. Amberdata’s option-flow analysis, published on Deribit Insights, estimates trade direction before analysing dealer exposure. Our unsigned snapshots do not implement that positioning model.
What we tested alongside price structure
This is the BTC BOS laboratory, a separate project from Klines. BOS means break of structure: a record of a confirmed price break built from information available at the time. We asked whether derivatives observed before that event could help distinguish what happened afterwards.
The analysis used the archive from late August to early October 2026, with exclusions for missing or unreliable collection windows. The source reports call it roughly five weeks of data; the calendar span is longer than the usable coverage. There were 17 hourly BOS episodes, six four-hour episodes and only two active daily regimes, both bullish. Those short events are not 17 independent market regimes.
Before the calculations, we fixed a primary family of ten tests. Features used information available at the event time; gaps were excluded rather than interpolated. Outcomes included the return after 24 hours and maximum adverse excursion over 24 hours (MAE24): the deepest move against the reference direction, measured from hourly highs or lows. Here MAE is zero or negative, so −1.5% is worse than −0.4%.
| Layer or idea | Observed status |
|---|---|
| Funding | No convincing association in the tested family. |
| Open interest and liquidations | Weak or inconsistent relationships; no validated filter. |
| Gamma asymmetry | A post-hoc association with adverse movement on structural transitions. |
| Aggressive option flow | A fragile candidate on hourly episode starts. |
| Gamma “magnets” or “walls” | No established mechanism or trading rule. |
The gamma result that deserves a second look
Across 36 valid transitions in the daily, four-hour and hourly structural state, gamma asymmetry had a Spearman rank correlation of −0.58 with MAE24. Greater relative exposure on the side of the active structural direction was associated with a deeper subsequent move against that direction.
We measured asymmetry as (gamma above spot − gamma below spot) / (gamma above spot + gamma below spot), using strikes within 5% of spot across calls, puts and all expiries. We then aligned its sign with the active daily direction, falling back to the four-hour and then hourly direction when the higher timeframe was inactive.
Spearman correlation measures how the rankings of two variables move together; it is not the percentage of correct predictions.
“On the side of the direction” matters. For a bullish reference it means above the current price; for a bearish reference it means below. The result is not simply “more gamma above spot predicts a fall.”
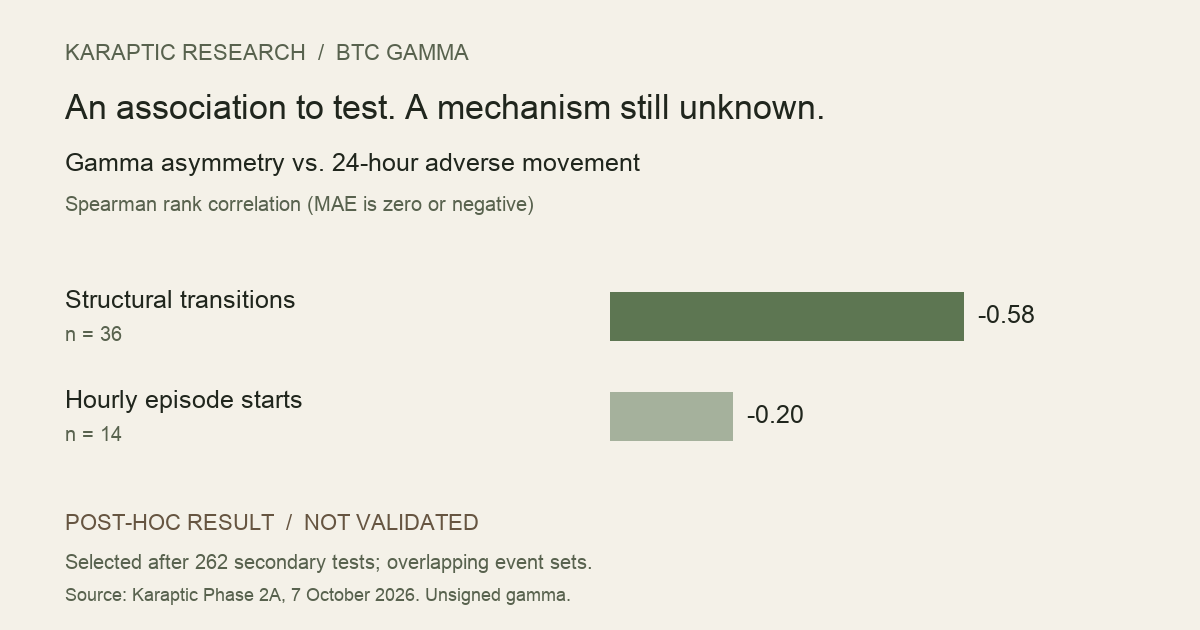
These events fall into only three daily clustering blocks: two bullish episodes and the inactive interval between them. Across the full set of 43 transitions, 41 had a bullish reference direction and two a bearish one. That split refers to the full transition family, not just the 36 gamma-valid observations; this sample cannot establish how the relationship behaves in bearish regimes.
The association persisted in within-sample checks that removed individual observations and thinned events to at least 24 hours apart. Thinning does not create independent market regimes. However, it weakened in the later period: the correlation was −0.64 before 16 September and −0.28 afterwards. On the 14 valid hourly episode starts, the same feature had a correlation of −0.20 and was not statistically significant.
The larger warning is how we found it: the gamma result was selected after examining 262 secondary tests. Its small individual p-value does not account for that selection. It did not qualify as a candidate under the original primary-test rule; we froze it separately as a post-hoc hypothesis. It remains unconfirmed.
What happened to the concentration idea?
The idea was to identify where option exposure clusters and ask whether those zones behave like magnets, barriers or accelerators. In this phase, we examined gamma asymmetry and distances to the highest-exposure strikes above and below spot. Strike shares were recorded descriptively.
That is only part of the concentration question. We did not establish a repeatable rule for price approaching a cluster, touching it, rejecting it or breaking through. We did not validate expiry-specific concentration or a signed dealer-gamma regime. Those would require explicit event definitions and separate tests.
The present conclusion is therefore limited: the tested concentration-related measures have not yielded a usable trading rule, while an asymmetry measure has yielded a hypothesis about adverse movement. Neither statement establishes that the clusters themselves cause that movement.
A second lead came from the option tape
Aggressive option flow aligned with an hourly BOS direction was associated with less severe adverse movement over the next day. The primary test used flow over the preceding 12 hours and had 14 valid events, with a rank correlation of +0.62 with MAE24.
It met our predeclared exploratory candidate rule, but its p-value after correction across the ten primary tests was 0.196. It did not survive that correction. Removing block and combo trades reduced the correlation to +0.35, and the relationship was much weaker on the broader transition set.
This is a second frozen lead, with a different origin and a different weakness. It is not confirmation of the gamma result or evidence that options now predict BTC direction.
What would make the next test informative?
We froze both definitions after the discovery analysis. The data boundary is 7 October 2026, 09:00 UTC; later events belong to the forward sample. Proposed minimums are 14 new valid hourly starts for the tape hypothesis and 30 new valid structural transitions for gamma. These are research targets, not a guarantee that the next sample will establish a result.
Reliable collection is part of the experiment. The gamma archive had a 109-hour gap in early October. A forward test needs fresh, valid snapshots, with the same exclusions and no redefinition of the feature after seeing its outcomes.
For now, there is no gamma-based entry, exit or risk filter to add to the scanner. The next claim to test is modest: does the frozen gamma asymmetry retain its association with adverse movement on new data? A successful replication would still leave causality, broader regimes and trading feasibility to investigate.
Evidence and scope
This field note summarises Karaptic’s Phase 1 data audit, Phase 2A exploratory attribution report and frozen candidate definitions, dated 7 October 2026. The reports and derived tables remain local while their GitHub publication is pending. The raw collector history is not publicly released, so this page does not offer a fully reproducible dataset.
The downloadable test summary records the event counts and correlations used above. Read it alongside the sampling, selection and dealer-position limitations in this article. In the CSV, gm_Aa is direction-aligned unsigned gamma asymmetry, and tp_fa_12h is direction-aligned 12-hour aggressive option flow. The p_perm values are naive permutation p-values that ignore regime clusters; p_holm adjusts the ten primary tests only. A blank gamma correction cell means no adjustment was supplied, not a zero p-value. The status column retains the analysis script’s labels; the separately frozen post-hoc gamma hypothesis is described above. For the wider research context, see BOS as a structural scanner.