
Field Note 09 / Momentum
We Tested Momentum on the Exchange You'd Actually Trade It On
Cross-sectional momentum has one of the strongest academic records in quantitative finance. That still does not answer the question a retail trader actually has: can I run it on the exchange I use and keep the spread after costs?
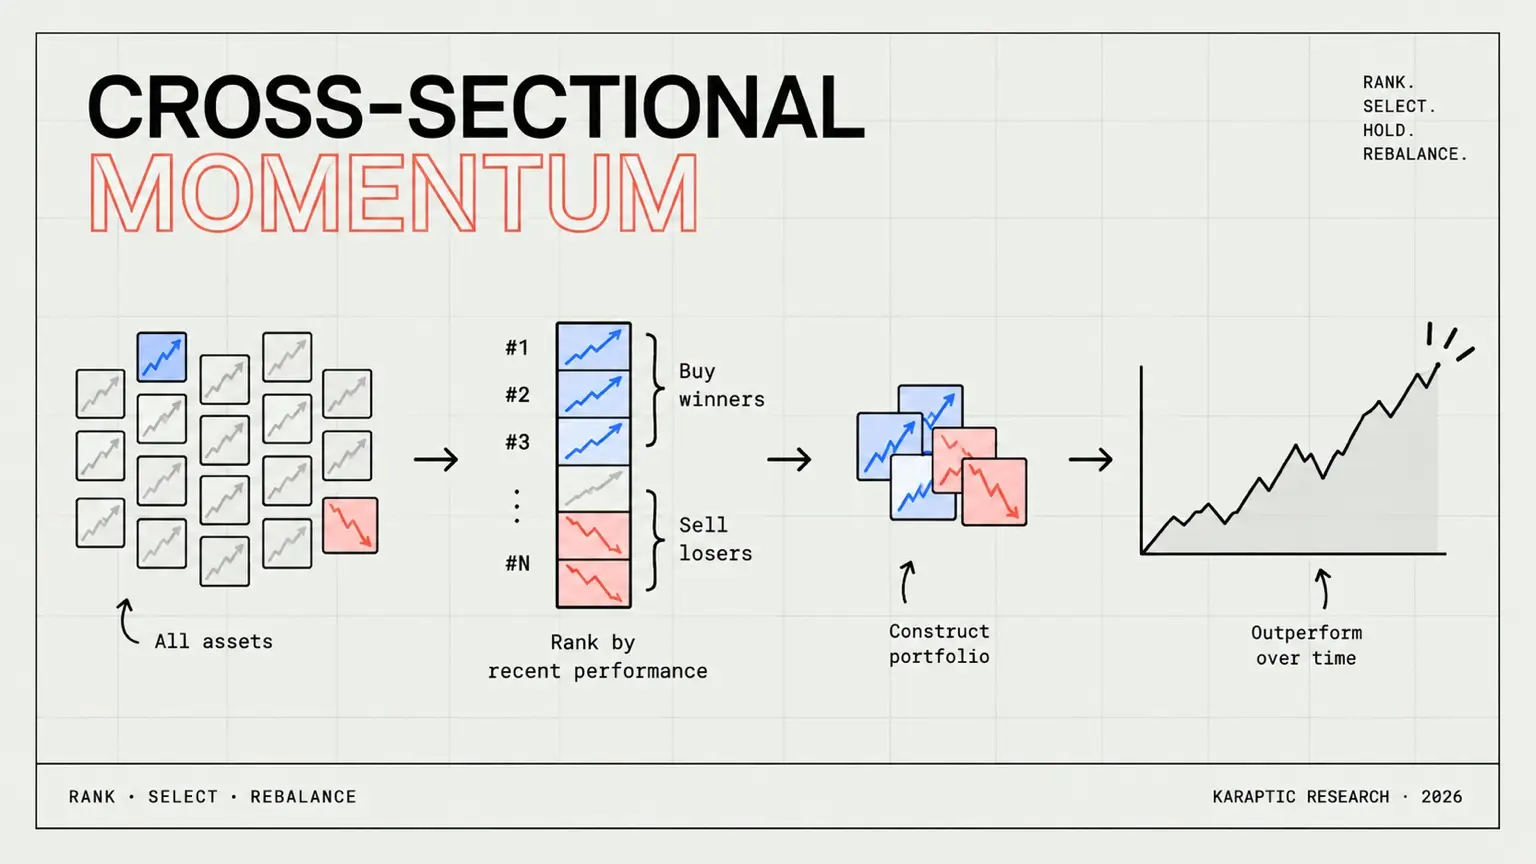
Cross-sectional momentum is one of the most replicated findings in quantitative finance: rank assets by recent return, go long the winners, short the losers, and the spread turns out positive more often than chance predicts. It shows up in equities, currencies, commodities, bonds, decades of data, and dozens of markets. In crypto specifically, Liu, Tsyvinski & Wu documented it as statistically significant across more than 1,700 coins.
That is a strong academic record. It is also, on its own, not an answer to the question a retail trader actually has: can I run this, on the exchange I actually use, after the exchange takes its cut?
Why the published evidence doesn't settle it
Most of the existing crypto momentum evidence comes from broad, market-cap-ranked universes built for academic testing, not from a single tradable exchange, and it is usually reported gross of trading costs. Starkiller Capital, an actual asset manager, is the one real exception worth naming: they published an honest in-sample and out-of-sample backtest spanning the 2021-2022 bear market, and their result is instructive on its own. Their strategy beat the market in relative terms through that crash without producing an absolute profit, and they named a concrete number where the whole thing stops working: 125 basis points of round-trip cost kills the effect.
125 basis points is a specific, checkable number. It is also from a fund's own construction, not from a single exchange's actual fee schedule. The gap between "an anomaly exists in the literature" and "I can run it on Binance and keep the money" was still open.
What we actually built
Our third working paper, Cross-Sectional Momentum in Cryptocurrency: A Net-of-Costs Replication on Tradable Binance Perpetuals (2020-2026), closes that gap with one specific, tradable universe: 832 Binance USDⓈ-M perpetual futures symbols, using a daily-close panel from January 2020 through July 2026. Every methodology choice was fixed before we looked at a single result: ranking date, entry timing, holding period, the liquidity threshold, and the exact rules for a forced close on delisting.
Over 338 independent weeks, the gross weekly spread came to +0.573%, positive in 52.7% of weeks. One of three independent significance tests, a within-week permutation test, passed at conventional significance. The other two, a bootstrap confidence interval and a sign-flip test, did not.
Where the spread actually goes
A Binance taker fee of 0.05% per side plus an assumed 0.05% per side of slippage adds up to 0.40 percentage points round trip, roughly 70% of the gross spread. Net of that, the weekly average drops to +0.173%, and the share of profitable weeks falls to exactly 50.0%. None of the three significance tests pass. The confidence interval that already covered zero at the gross level shifts further toward the negative once costs come out.
A positive gross spread is not yet a tradable edge. The relevant result is what remains after fees, slippage, and specification stability.
The part that made us slow down
A second specification was not optional. The project's own rule allows exactly one literature-backed alternative if the first one fails, and two independent sources, Dobrynskaya and Li & Zhu, both pointed at a two-week formation and holding period as more robust than the one-week version we started with. So we ran it: non-overlapping two-week periods, split in advance into a headline phase and a diagnostic phase specifically so we could not quietly pick whichever one looked better after the fact.
The headline phase came back net positive, +0.429% per week. The diagnostic phase came back negative, -0.076% per week. The only difference between the two is which Monday the non-overlapping windows start counting from, an arbitrary calendar choice that carries no market information. That is not simply a weak result. It is a result that changes sign depending on a coin flip made before looking at any data.
What this does and doesn't say
This is not evidence that momentum is fake. The academic record behind it, across markets and decades, does not get overturned by one exchange, one cost structure, or one seven-year window. What it says is narrower: a specific, honestly costed, pre-registered implementation of a well-documented strategy, run on the exchange most retail traders would actually use, did not produce a spread that survives its own trading costs. The one adjustment permitted by the literature did not fix that either.
Full replication code, weekly figures, and all three significance tests: Momentum: Evidence from a Binance Replication →. The paper is available as SSRN 7404139 →, a preprint that has not yet been peer-reviewed. Related research: The Grid Bot Illusion → and Trend: When Published Edge Ages →.